> TL;DR:
C++ performance is hairy for tons of small object allocations / deallocations especially when the compiler cannot intuit what you are trying to do Ahead-of-Time. Memory pools might resolve this issue but for nested calls finding free objects to acquire is tougher. Rust also performs poorly in this scenario. The JVM is king at this kind of problem thanks to the JIT and Garbage Colector.
Introduction
Some months ago, I decided to walk through a popular programming languages book called Crafting Interpreters by Rob Nystrom. The book teaches you to build an interpreter for a dynamic language called Lox in Java. I followed along and wrote my implementation in C++, hoping for greater performance.
There are a couple common ways to structure interpreters i.e. bytecode, tree-walk, stack. Rob uses a “tree-walk” approach, where the parser transforms the code into a tree data structure. The interpreter then recursively walks each node in this tree and executes the corresponding commands.
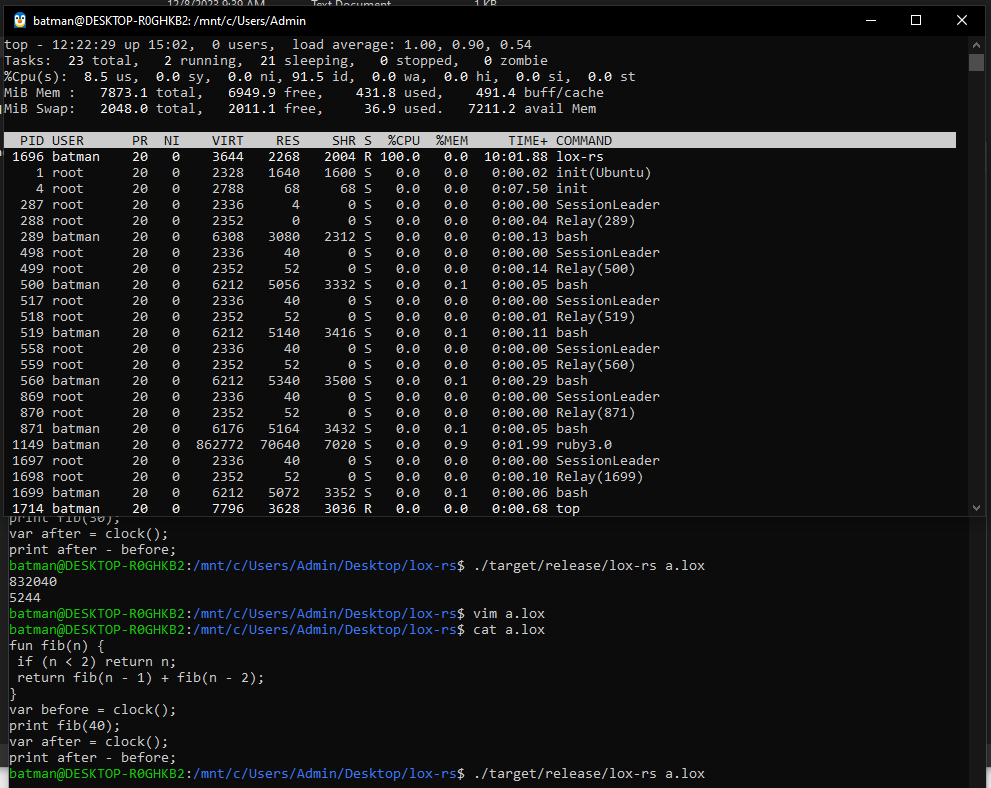
This works pretty well for simple scripts. but during the introduction to Part III of the book, which involves writing a bytecode virtual machine, Rob uses the example of fib(40) to show how a tree-walk interpreter is fundamentally the wrong design to tackle this sort of problem. And I understand that. But what I didn’t understand was how his Java implementation took 72 seconds to run (took 79.4 seconds on my system) and my C++ implementation couldn’t even execute it because it kept getting killed by the OS.
I figured there had to be something going on performance-wise that I was missing between Java and C++. So I decided to dig deeper into why calculating C++ interpreter performed woefully on fib(40), while Java handled it relatively easily.
> A Quick Note
The interpreter pipeline is staged as Scanner -> Parser -> Resolver -> Interpreter. Only the interpreter was having performance issues.
> Yes, some things come to mind
Before I go down this rabbit hole, I know that these are simple and reasonable solutions.
- Just write an iterative solution, dude! That’s no fun.
-
Write the bytecode compiler part of the project. I already tested this. clox, which is the bytecode VM implementation of the Lox interpreter written in C, performs this task in 10 seconds. How? Mark and sweep garbage collection and recursive call flattening (clox is stack-based) were implemented. Much less overhead.
- Memory pooling: This means reimplementing my own allocator to allow for chunk-based alloc/dealloc inside the program, as malloc is expensive. Won’t work for our pain point (recursive calls) due to its stack-based nature. For a tree like fibonacci it might help after we’ve gone through the worst of it (fib (39)). It seems a stupid solution because I would’ve just memoized at that point.
> Of course, in pure C++ it computes.
The real difference is the overhead of execution and the hidden runtime nature of the program from the compiler.
> Investigating the problem
> Why am I interested?
This is probably my first time experiencing a notable performance limitation. Not just low FPS or slow progression, but actual refusal to compute. The only other thing like this I have experienced is Python’s max recursion depth.
Fundamentally, I knew it was a memory error, because why else would it get killed in that manner? If it was just a CPU performance issue, it would have eventually computed. If it was an implementation bug, I would have gotten a result. The OS was killing my process because it was hogging resources.
> My Ignorance
Of course, the first thing I did was find out just how badly my program was performing memory-wise. So I fired up Valgrind and did a leak check. It was abysmal, to say the least. But I was expecting it. To cut it short, I had neglected the use of smart pointers throughout and went with manual memory management while avoiding freeing any memory at all.
There were reasons—though not entirely justifiable, they were reasons nonetheless. The first had to do with my code structure. I was using derived classes throughout my implementation for my expressions and statements. This was to allow a unified manner of access for my ExprVisitor and StmtVisitor classes. Well, C++ does not like this too much. I was fine using dynamic casts explicitly when I knew what the derived class was i.e.
return new Call(calee, dynamic_cast<Variable*>(callee)->name, arguments);
I had a lot of virtual classes littered through my code. And at the time, when I tried to create a shared pointer for a virtual class, like so:
std::make_shared<Base>()
It wasn’t allowed because you cannot instantiate an abstract object. But recently I found that there might be a way around this :
std::shared_ptr<Base>()
I looked at some other implementations and the ones I saw made me believe I would have to scatter std::any everywhere to make it work. Which I strongly didn’t want.
But this was not true.
I eventually got a clean C++ implementation of the lox tree-walk interpreter to test alongside here.
> Trying a proper implementation
I thought the issue was purely with my leaky implementation. I found a well-written C++ implementation of the lox interpreter and gave it fib(40) to chew on.
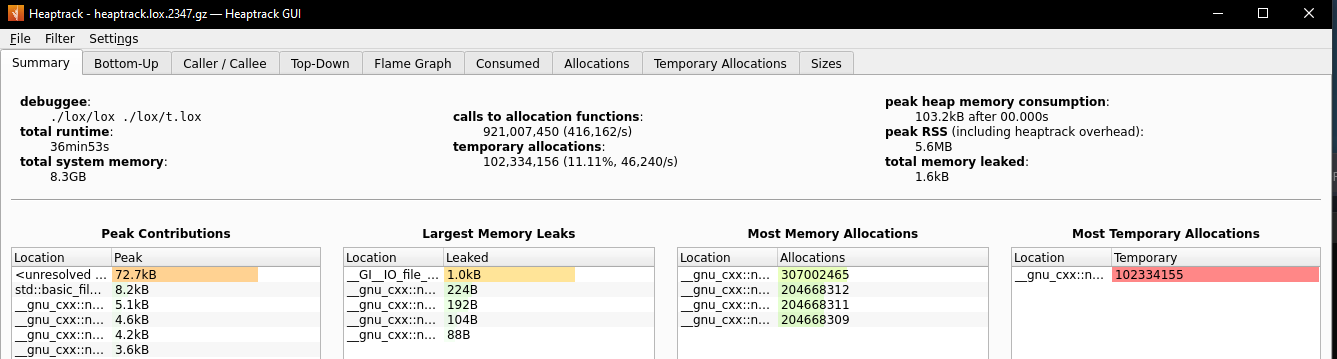
The first couple of times I tried it, I did not expect it to complete successfully. But just recently, I tried it again. And after 36 minutes, it gave the correct answer.
Just from the heaptrack analysis you can see that 921 million allocation calls were made. This is an astronomical number. Yet it still managed to use only 103.2kB heap memory at peak. For comparison, my leaky C++ implementation utilized 117MB on fib(25) with 5.2 million allocation calls.
> Why does it take so long.
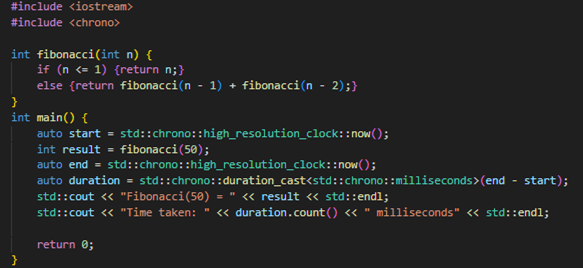
The time complexity of recursive fibonacci is Φ^n ≈ 1.618^n, Φ being the golden ratio. So fib(40) takes 1363.57x more time to compute than fib(25). This matches up with an expected compute time of 1.584s for fib(25) . Given my lack of memory management, we can assume memory usage scales by the same amount if not more. This is why my leaky implementation got killed by the program.
> Java vs C++
Now with that out of the way, the real question was to find why C++ performance lagged so far behind Java’s.
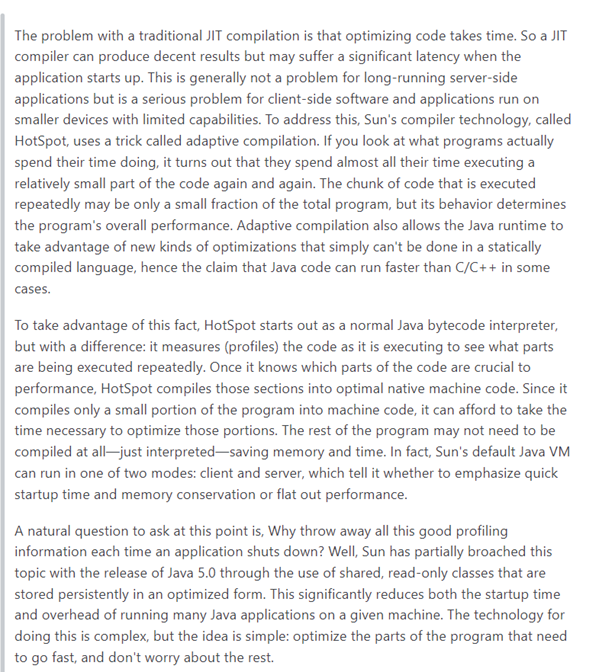
The two important differences between Java and C++ in this situation would be the JIT and GC. Since C++ uses Ahead-of-Time Compilation, and the only code presented to it doesn’t hint anything about the nature of the programs that will be executed, it cannot outperform Java’s Just In Time compilation system, which selectively compiles hot functions during execution.
The second important difference between Java and C++ would be garbage collection. In short, Java uses a mark and sweep algorithm for garbage collection during GC pauses and this fares well for mass alloc/dealloc of small objects while C++ requires manual management and temporary allocs/deallocs, especially on the heap are expensive, even more so for hundreds of objects.
While this is all nice and good, I tried to find more information on how exactly this JIT magic works for any JVM, and while there are some open-source JVMs, I didn’t go too deep. I read some books hoping to gain more insight into the JIT’s workings, but I didn’t find what I was looking for. I learnt about the tradeoffs between running on the VM and compilation, hotspots and running JIT in tandem, but it wasn’t enough. Still magic to me.
> The real culprit (temp allocs/deallocs)
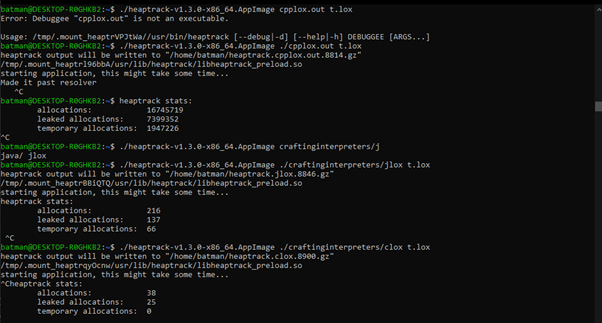
When I analyzed clox, jlox, and my C++ implementation with heaptrack, I noticed my C++ program allocated memory orders of magnitude more times than the other two for the fibonacci(30) test.
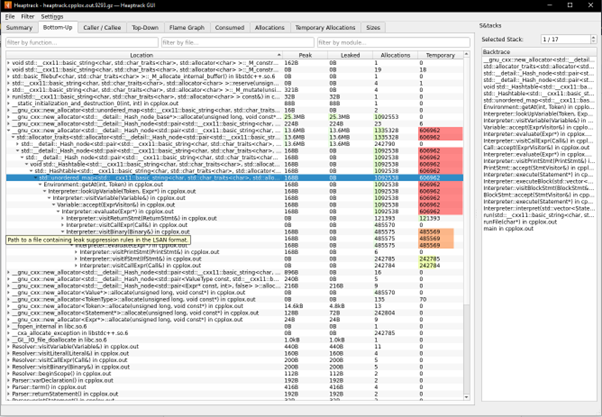
Looking inside the UI for more information, this is what the path of memory usage looks like. The bulk of new memory creation obviously comes from the recursive hot path. No single function can really be pinned as the source of all memory problems (from what I’m seeing), as the call chain is extremely long.
This was also the case for the clean C++ implementation I found with much fewer leaks than my C++ implementation but still orders of magnitude higher allocations than the jlox/clox binaries.
> Trying Rust
I was interested in how Rust would perform. Maybe they were trying to hide their tracks but every reasonably completed implementation I saw did not stop at the interpreter. So I simply found a good enough one link and checked out the last interpreter branch.
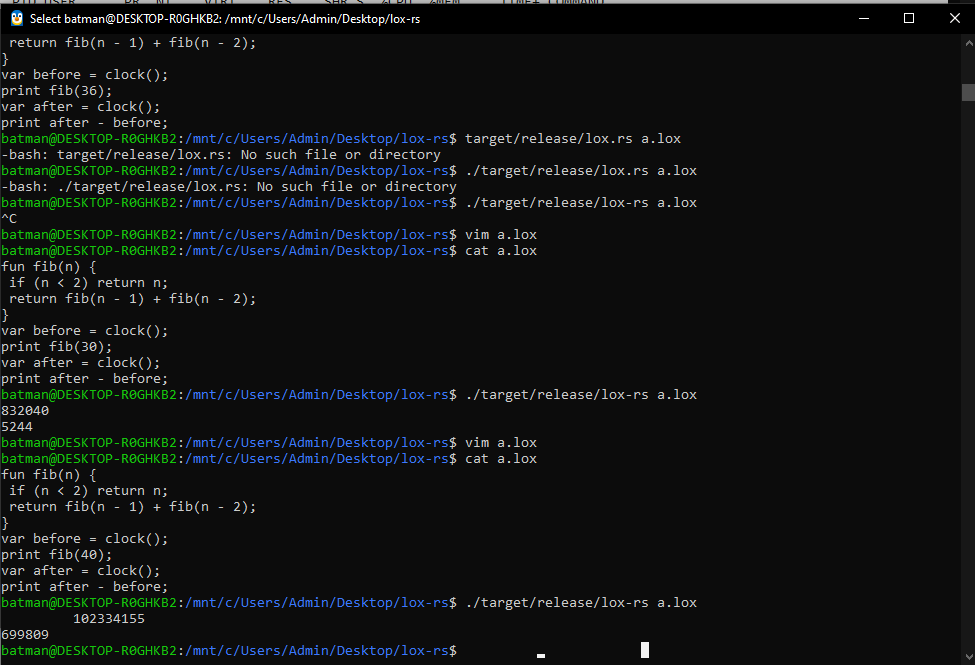
The ClockCallable of the implementation was broken but that was fine. It computed fib(30) in less than 30 seconds. I almost gave up on fib(40) being computed but it finished after 12 minutes.
To be fair I was expecting this a bit, as both Rust and C++ were AOT compiled and had the same GC methods (smart pointers vs lifetimes).
The Rust implementation beat the clean C++ implementation by 3x. This was the Rust release build against C++ with no optimization settings. So not at all fair.
> More analysis
I got into C++ because I wanted to learn more about performance, and this was the perfect opportunity to try all the tools I hadn’t before. So I fired up heaptrack and FlameGraph for my shitty C++ interpreter, jlox and clox, to compare heap memory usage and performance. But in all honesty, I just wanted to see some nice visuals.
Flame Graphs
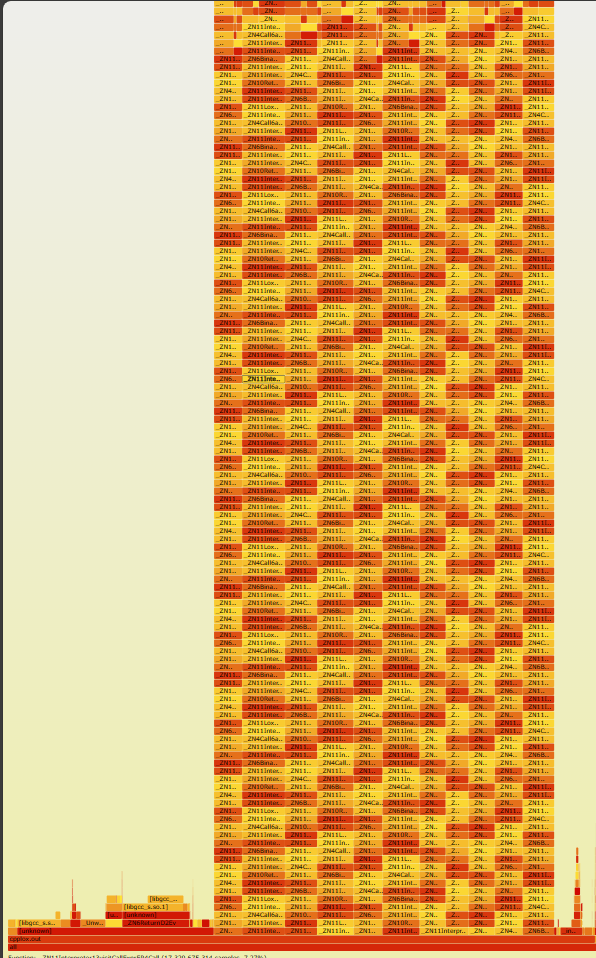
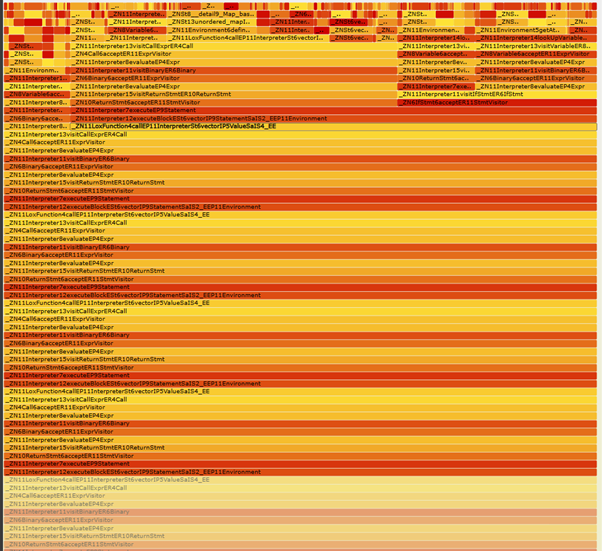
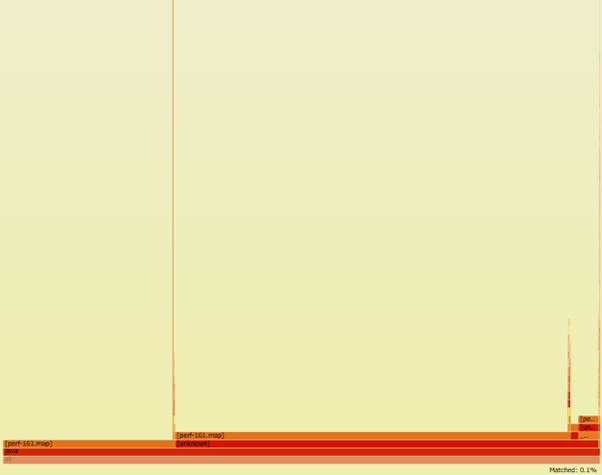
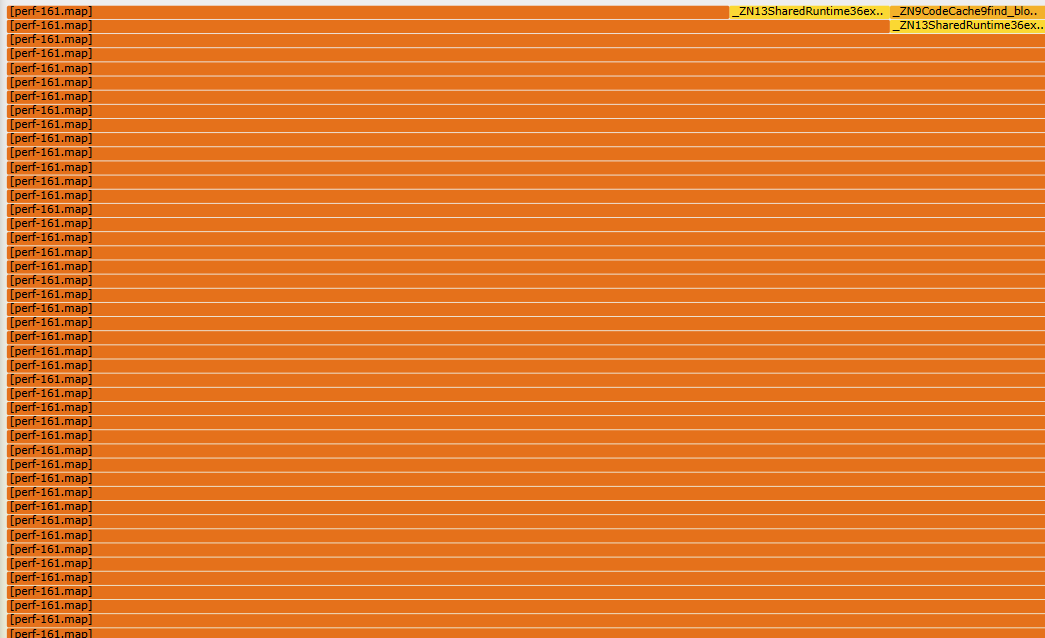
Comparing the flame graphs of my C++ implementation and the Java implementation, I couldn’t really make sense of the differences between the two. From C++ I could easily see the recursive function calls and tree-walking as a result of the fibonacci calls, but for Java it was completely flat and the labels weren’t helping either. What I did find to be weird were the extremely thin graph stacks extending upwards and coming downwards immediately. Yet the only information waiting there for me wasn’t at all helpful.
> Trying to not get killed
I tried some other things in hopes my program would not get killed.
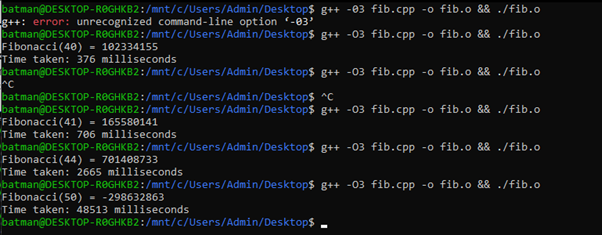
1. Aggressive compilation flags
g++ has different optimization levels with slower build times. The default flag is -O0 which is unoptimized and mainly for debugging, but it goes up to -O3 and -Ofast.
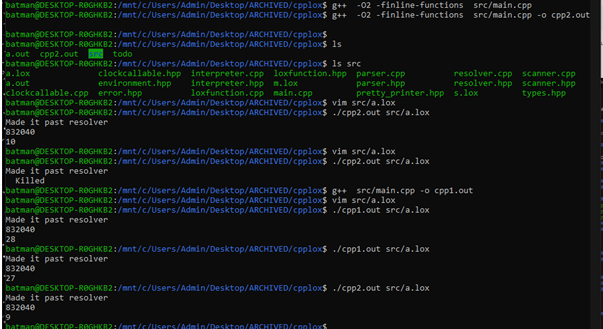
Just using the -O2 and -finline-functions compilation flags gave me 3x performance on fib(30).
2. Profile guided optimization
The JIT compromise for AOT compilation would be profile-guided optimization. What this does is guide the AOT compiler to optimize for some specific use-case. I did this using
g++ -O3 -fprofile-use src/main.cpp -o cpp_prof.out to generate the executable for profiling, which I then ran with the preferred scenario ./cpp_prof.out src/a.lox which generated a gcda file.
The final executable was then generated g++ -O3 -fprofile-use src/main.cpp -o cpp_prof.out and it knew to use the corresponding gcda file for the executable name.
While this worked for optimizing the specific example I gave it which was fib(30) from 21 secs to 13 secs , it did not help my leaky implementation attain fib(40).
3. Changing allocators
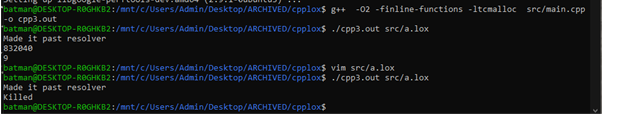
I decided to try out TCmalloc, mainly for the sake of trying out another allocator. After all, TCMalloc was created with the aim of faster multi-threaded memory management, which wasn’t the issue at hand. Needless to say, it failed.
While none of these made my leaky implementation suddenly viable, it showed me possible performance improvements for the clean C++ implementation. I believe a 3-4x boost is possible, putting it on par with Rust.
> Stack fiddling
I wanted to see if changing the stack size would have any effects on the program.
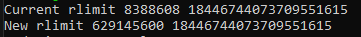
I was able to change the program stack size using rlimit which are linux syscalls for changing resource limits. I changed the soft limit to a whopping 600MB but it didn’t affect my results.
I tried out some stack analysis tools, using data I got from the -fstack-usage -fdump-ipa-cgraph compilation flags and this tool.
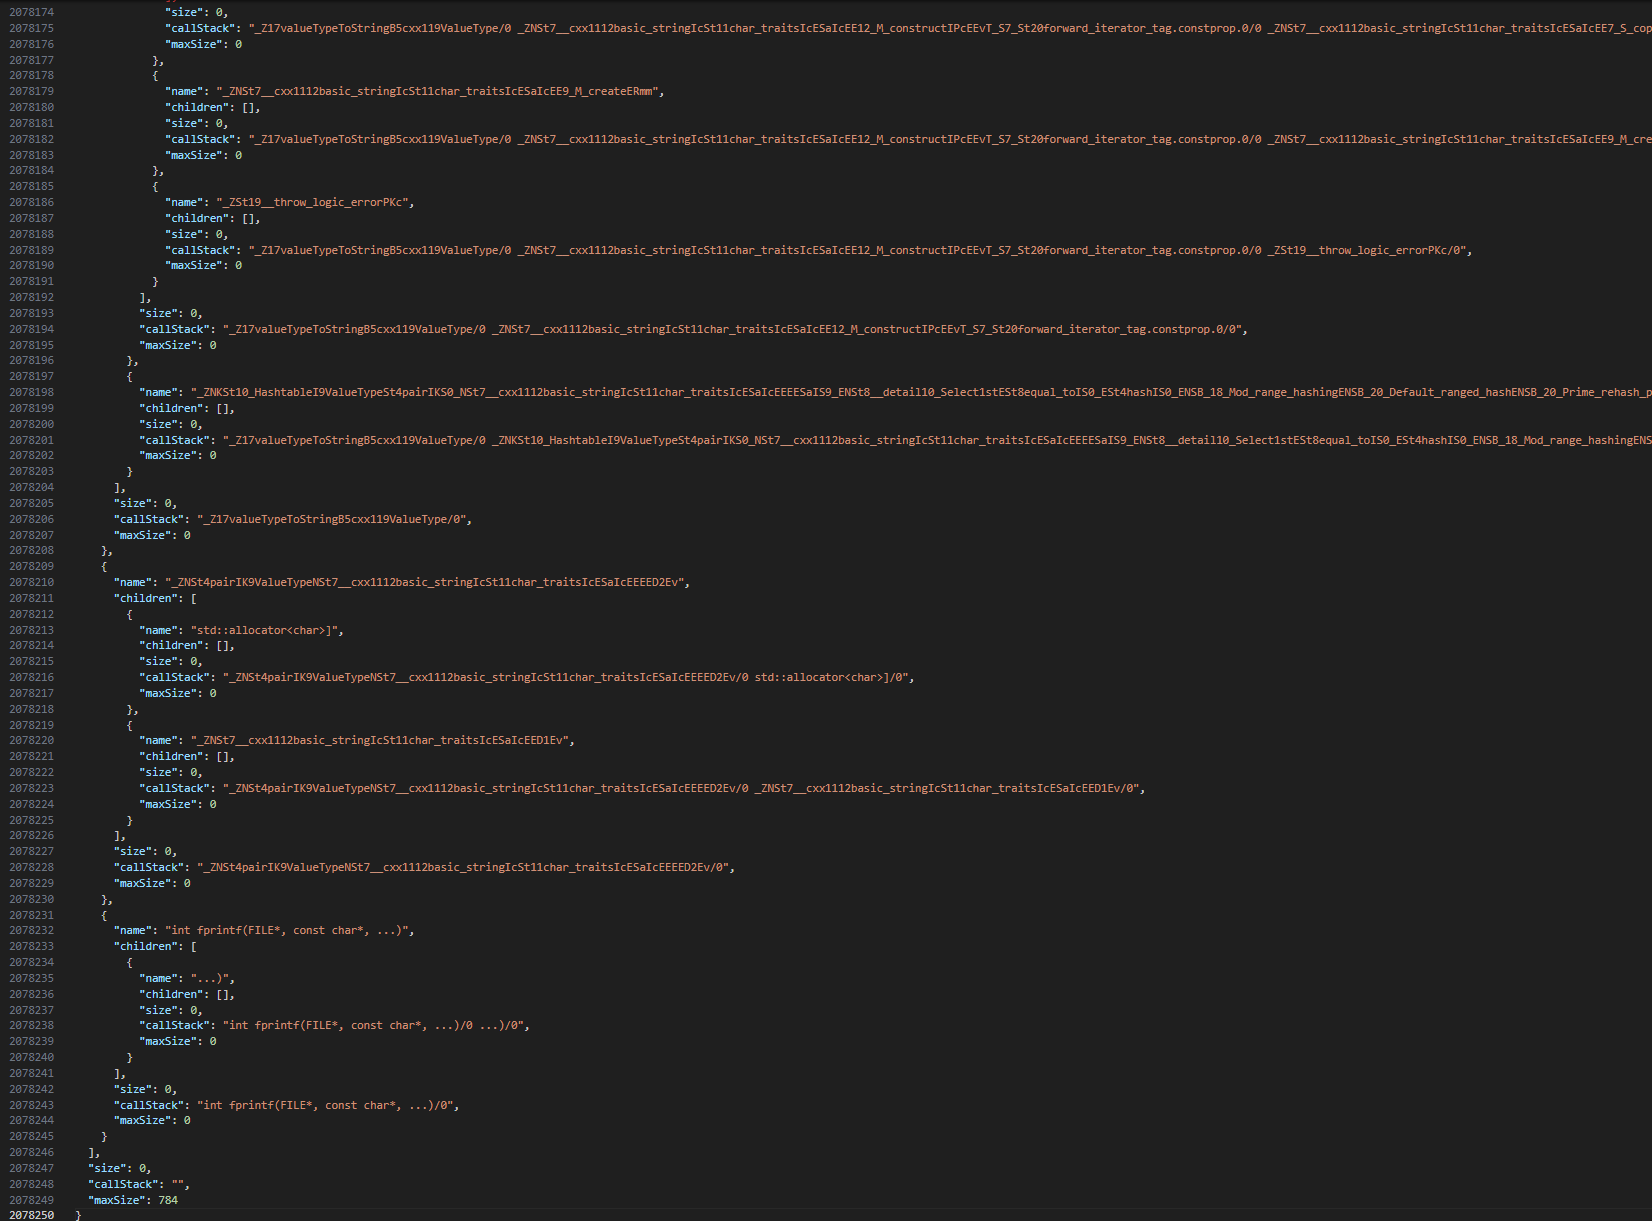
The data I got back showed that over 99% of my function calls were not using any stack memory, and the maximum stack size of my program was 784 bytes.
> Trying cppcheck / static analysis
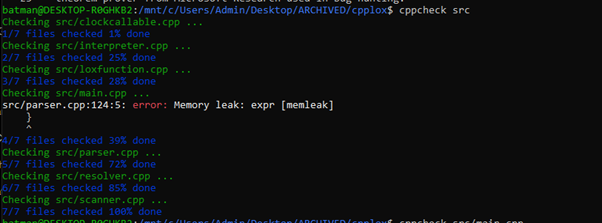
I was expecting a more detailed analysis from cppcheck as to why my program was failing ( besides the obvious issue of course) and if there were any ways around it (besides memory management) but all it gave me was some commentary on the parser.
> Conclusion
The JVM can be a performance wizard. Beats Rust by 10x and C++ by 30x in this scenario due to JIT compilation and better performance of the GC for large-scale alloc/dealloc of small objects.
Clean up your C++ code if you don’t want it to get killed by the OS.